Extinction Watch
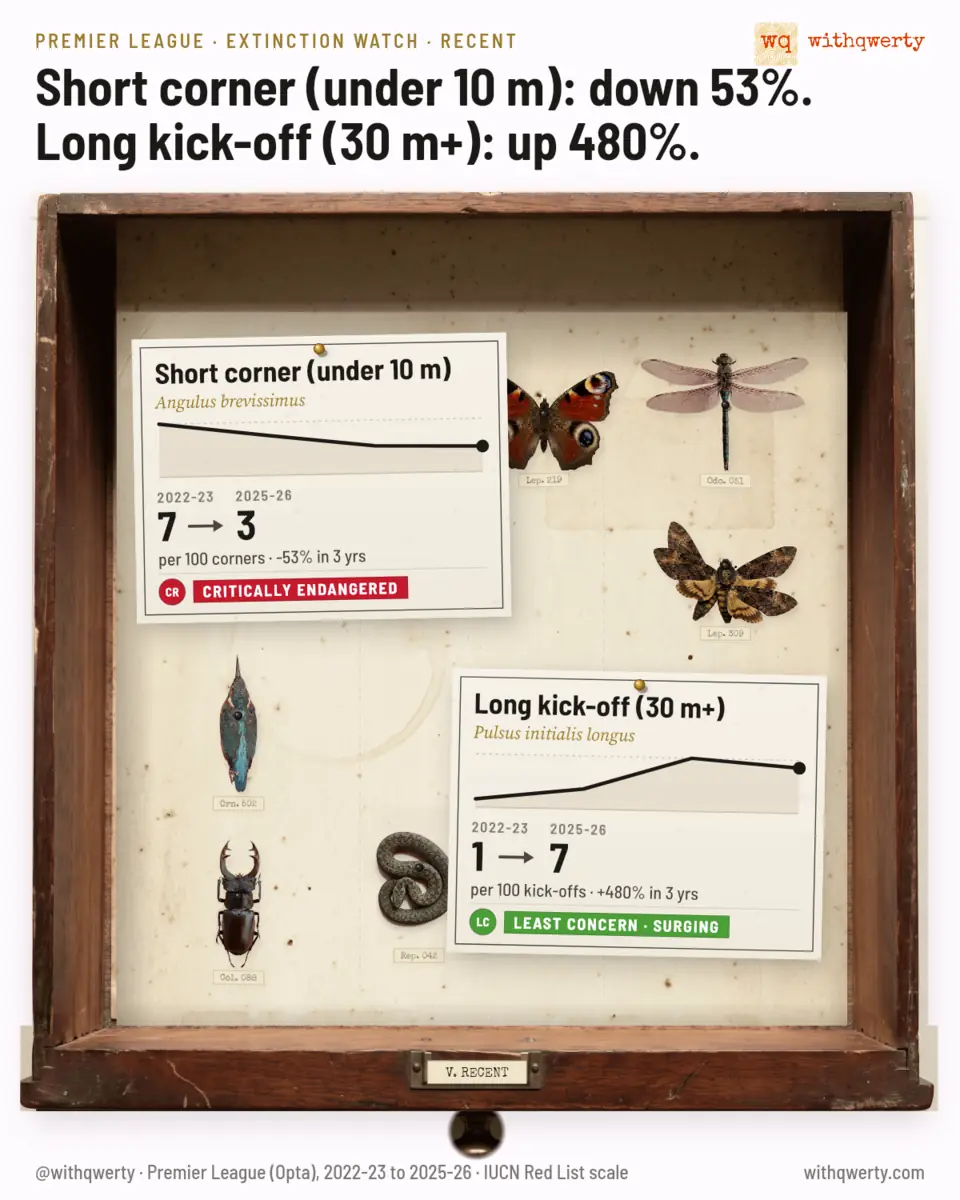
Red List specimen cards for the things football is doing less of. Each card gives the rate then and now, and a conservation status.
- Goes out
- Fortnightly, Friday 11:30 UK
- Data
- Opta event data, Premier League, 2015/16 onwards
Methodology
- A watchlist of 103 series from Opta event data, each a rate (for example, short corners per 100 corners).
- Two horizons take turns: a 10-year structural shift (2015/16 to 2025/26) every four weeks, and a recent shift (2022/23 to 2025/26, plus a statistically gated year-on-year change from gameweek 6) in the fortnights between.
- Status follows the IUCN scale from the size of the fall: 45% or more is critically endangered, 32% or more endangered, the rest vulnerable. A sharp rise is shown as least concern, surging.
- A fall caused by a rule change is not given a status. Every edition is approved by hand before it posts.